 The Market
Alphabet’s Q3 2026 revenue grew 25% to $127.6 billion and Google Cloud more than doubled. The stock still dropped about 13% the next day. The reasons were in the parts of the report most people skip: results came in below expectations, a one-time investment loss cut reported EPS, and record AI spending pushed free cash flow negative. Here’s how to read each piece.
Alphabet, the parent of Google and YouTube, reported third-quarter results after the close on October 28, 2026 (Alphabet earnings release, SEC filing; Alphabet investor relations). We’ll use it as a worked example of how to read any earnings report. If the three financial statements are new to you, start with how to read financial statements.
Step 1: Compare the headline to expectations
Analysts publish estimates before every report, and the stock price already reflects them. So the first question is never “was it good?” but “was it better or worse than expected?”
| Metric | Q3 2026 actual | Analyst estimate | Result |
|---|---|---|---|
| Revenue | $127.58B | $128.22B (LSEG) | Miss |
| Adjusted EPS | $2.67 | $3.02 (LSEG) | Miss |
| Search & other revenue | $63.35B | $64.96B | Miss |
| Google Cloud revenue | $30.7B | $28.7B | Beat |
| Free cash flow | −$9.07B | −$2.70B | Worse |
Sources: CNBC, Alphabet release.
CNBC called it Alphabet’s first top-and-bottom-line miss in nearly four years (CNBC). Revenue growing 25% sounds great on its own. But when investors expected more, “great” can still mean “disappointing.”
Step 2: Know which EPS you’re looking at
The release reports diluted EPS of $2.12, down from $2.87 a year earlier. CNBC’s comparison uses adjusted EPS of $2.67. Why two numbers?
- GAAP EPS ($2.12) follows standard accounting rules and includes everything.
- Other income and expense swung from a $12.76 billion gain a year ago to an $8.22 billion loss. Most of that was an $8.66 billion loss on equity securities, which are investments Alphabet holds in other companies. The company says this loss cut net income by $6.7 billion and diluted EPS by $0.55 (Alphabet release).
- Add that $0.55 back to $2.12 and you get $2.67, the adjusted figure analysts compared with their $3.02 estimate.
The lesson: gains and losses on investments can swing reported earnings by billions without telling you much about the core business. Always check what’s inside “other income” before judging the bottom line. Here, even after stripping out the loss, EPS still missed.
Step 3: Break revenue into segments
The total hides very different stories. Alphabet reports three segments (Alphabet release):
| Segment | Q3 2025 revenue | Q3 2026 revenue | Growth | Q3 2026 operating income |
|---|---|---|---|---|
| Google Services | $87.05B | $96.30B | +11% | $39.16B |
| Google Cloud | $15.16B | $30.71B | +103% | $11.12B |
| Other Bets | $0.34B | $0.37B | +8% | −$2.05B |
Inside Google Services, Search & other grew 12% to $63.35 billion and YouTube ads rose to $11.21 billion from $10.26 billion.
Two things to notice:
- Cloud is now about a quarter of revenue ($30.7B of $127.6B) and its operating margin rose to about 36% from about 24% a year earlier (our calculation from the segment table). A business that grows fast and gets more profitable is the strongest combination in an earnings report.
- Search is still the profit engine. Google Services made $39.2 billion of operating income, a margin of about 41%. That is why a small Search miss mattered so much to investors.
The company reported total operating income of $40.58 billion, up 30%, for an operating margin of 31.8%. That still missed FactSet’s $43.19 billion forecast (CNBC).
Step 4: Follow the cash, not just the profit
This is where the quarter got interesting. Free cash flow is the cash a business generates after paying for its investments:
Free cash flow = cash from operations − capital expenditures
For Q3 2026 (Alphabet release):
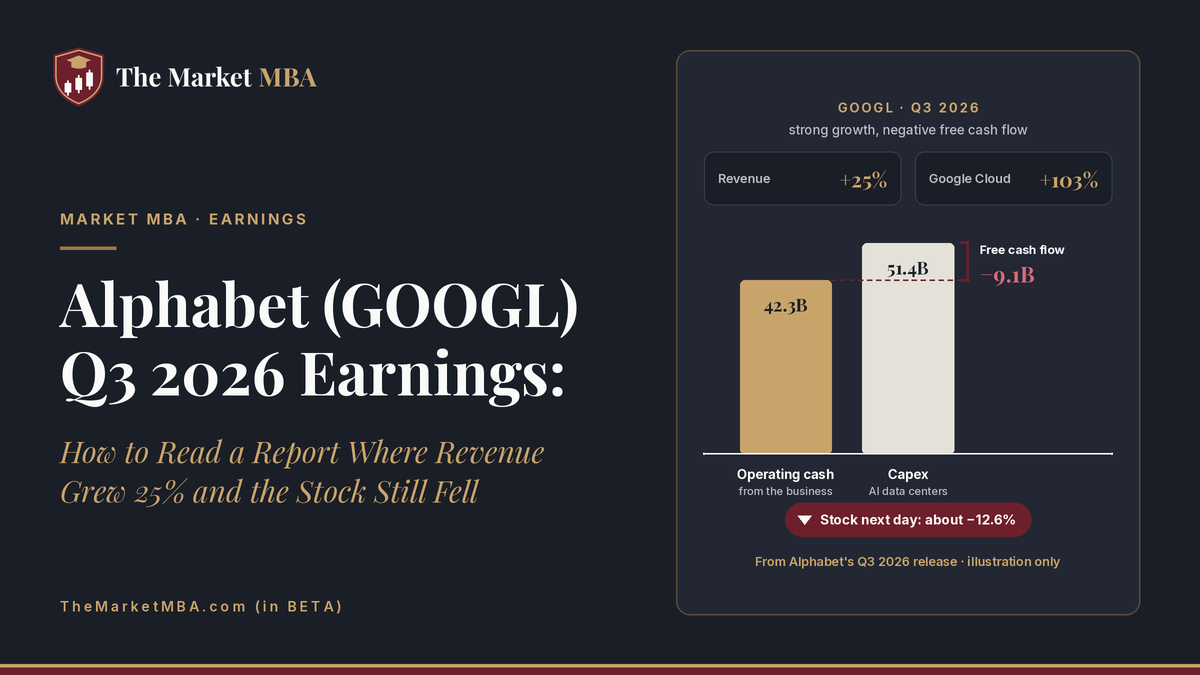
- Cash from operations: $42.29 billion
- Purchases of property and equipment (capex): $51.36 billion, up from $23.95 billion a year earlier
- Free cash flow: −$9.07 billion
That’s the second straight negative quarter (Q2 was −$5.86 billion). Over the trailing twelve months, free cash flow was still positive at $19.75 billion. The money is going into data centers, chips and servers for AI. Alphabet kept its 2026 capex forecast at $195 billion to $205 billion, and CFO Anat Ashkenazi said, “We continue to expect our capex to increase significantly in 2027” (CNBC).
Why this matters for valuation: a stock’s value ultimately depends on the cash it returns to owners over time. Heavy spending today can pay off later, but investors have to estimate how much cash it will eventually produce. We walk through that math in how to calculate the intrinsic value of a stock.
Step 5: Check how the company is paying for it
The cash flow statement’s financing section shows where the money came from (Alphabet release):
- Buybacks: $0 in Q3 2026, compared with $11.50 billion in Q3 2025.
- New shares sold: 12 million Class A and 24 million Class C shares through an at-the-market program, for about $12.4 billion of net proceeds.
- New debt: senior notes with $28.7 billion of net proceeds. CNBC reports long-term debt rose to $125.1 billion from $21.6 billion a year earlier (CNBC).
- Dividend: still paid, $0.22 per share, payable December 14, 2026.
A company that used to buy back its own stock is now selling new shares and borrowing to fund growth. Neither is automatically bad, but it changes the math for shareholders. New shares spread profits across more owners, and new debt adds interest costs. Interest expense rose to $967 million from $143 million a year earlier.
Step 6: Read the market’s reaction
GOOGL closed at $324.89 on October 28, before the report, and at $283.82 on October 29, a drop of about 12.6% (Yahoo Finance price history; percentage is our calculation). As of midday November 3, 2026, it traded near $280.
Big moves on earnings usually happen for one of these reasons:
- Expectations were high. A stock priced for a beat can fall hard on a small miss. That’s a key reason the hottest stocks fall the hardest.
- The cash story changed. Investors watch free cash flow and capex guidance as closely as revenue.
- Guidance and commentary. “Capex to increase significantly in 2027” tells investors more spending is coming before the payoff.
Your earnings-report checklist
- Compare revenue and EPS to the consensus estimate.
- Find out whether the EPS is GAAP or adjusted, and what’s in “other income.”
- Break revenue and operating income into segments.
- Calculate free cash flow: operating cash flow minus capex.
- Read the financing section for buybacks, share sales and debt.
- Listen to the guidance, because the stock trades on the future.
What we said on X
We covered the reaction live on X: GOOGL got smoked after earnings, down 11%+.
Sources
- Alphabet Q3 2026 earnings release (SEC Exhibit 99.1, Oct. 28, 2026): https://www.sec.gov/Archives/edgar/data/1652044/000165204426000080/googexhibit991q32026.htm
- Alphabet investor relations: https://abc.xyz/investor/news/news-details/2026/Alphabet-Announces-Third-Quarter-2026-Results-2026-FCcqxfIfmh/default.aspx
- CNBC, “Alphabet sinks 10% as it holds 2026 capex unchanged, expects significant increase in 2027” (Oct. 28, 2026): https://www.cnbc.com/2026/10/28/alphabet-googl-earnings-q3-2026.html
- Yahoo Finance, GOOGL price history: https://finance.yahoo.com/quote/GOOGL/history/
- Margins and percentage changes marked as our calculation: The Market MBA, from the figures above
🌐 MrFlourishinvests.com (in BETA) – Daily market moves, stock ideas, and money flow from MrFlourish and Team.
🌐 TheMarketMBA.com (in BETA) – Plain-English lessons on how markets, investing, and money really work crafted by MrFlourish and Team.
NFA
For education only. Not financial, investment, legal or tax advice.
For education and entertainment only. Not financial advice.