 The Market
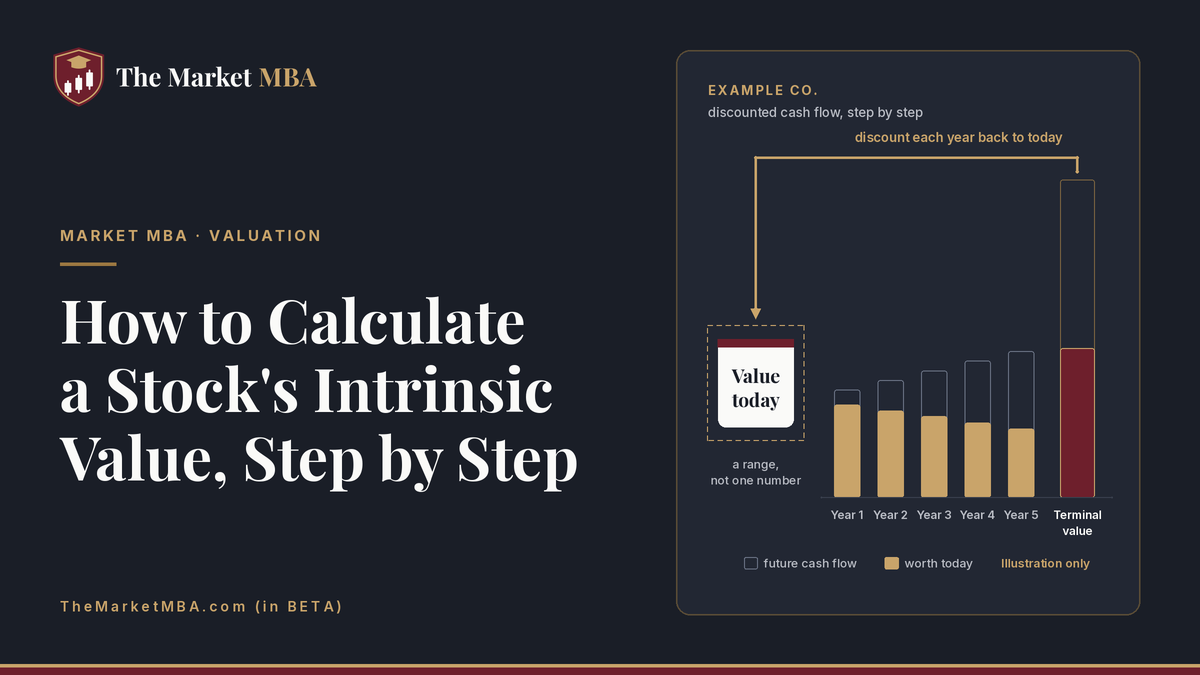
Intrinsic value is an estimate of what a business is worth based on the cash it can produce in the future. The common method is a discounted cash flow: project free cash flow for several years, add a terminal value, discount everything back to today, subtract net debt and divide by shares outstanding. It’s an estimate, not a fact.
A stock’s price tells you what the last buyer paid. It doesn’t tell you what the business is worth. This lesson walks through one complete valuation of a made-up company, start to finish, so you can see where every number comes from and how much each assumption matters.
Price vs value: what “intrinsic value” means
Warren Buffett’s definition in Berkshire Hathaway’s Owner’s Manual is a good starting point: intrinsic value is the discounted value of the cash that can be taken out of a business during its remaining life. He adds two warnings in the same passage. It’s an estimate, not a precise figure, and two people looking at the same facts will almost always arrive at at least slightly different numbers.
Keep that in mind throughout. Valuation is an estimate; reasonable people get different answers. The goal isn’t a perfect number. It’s a reasoned range you can compare with the market price.
Benjamin Graham’s line, as Buffett quoted it in his 1987 letter, explains why the gap between price and value can exist at all: “In the short run, the market is a voting machine but in the long run it is a weighing machine.”
The three inputs that drive any valuation
Every discounted cash flow (DCF) model rests on three judgments:
- Cash flow. How much cash the business generates for its owners today.
- Growth. How fast that cash might grow, and for how long.
- Discount rate. The annual return you require for taking the risk of owning it. A dollar in five years is worth less than a dollar today, and the discount rate sets how much less.
Change any one and the answer changes. You’ll see exactly how much in the sensitivity table below.
Step-by-step: a simple DCF for “Example Co.”
Example Co. is hypothetical. All figures are in millions of dollars except per-share numbers, and every input is an illustrative assumption, not a recommendation.
Step 1: Start from free cash flow
Free cash flow (FCF) is usually calculated as cash flow from operating activities minus capital expenditures, both found on the cash flow statement (see our guide to how to read financial statements). It isn’t a GAAP measure, and the SEC notes it “does not have a uniform definition,” so when a company reports it, read how the company calculated it.
Example Co. had operating cash flow of $160 million and capital expenditures of $60 million last year:
FCF = $160M − $60M = $100M
Buffett describes a related idea, “owner earnings,” in his 1986 letter. More on that in the FAQ.
Step 2: Project five years with a conservative growth rate
We’ll assume FCF grows 5% a year for five years. That’s an assumption about this made-up company, not a typical rate.
| Year | FCF ($M) |
|---|---|
| 1 | 105.0 |
| 2 | 110.3 |
| 3 | 115.8 |
| 4 | 121.6 |
| 5 | 127.6 |
Step 3: Add a terminal value
A business doesn’t stop at year 5, so we estimate the value of all cash flows after that in one number, the terminal value. A common approach assumes cash flow grows at a steady, modest rate forever:
Terminal value = Year 6 FCF ÷ (discount rate − long-term growth rate)
NYU Stern professor Aswath Damodaran points out that a growth rate that lasts forever can’t exceed the growth rate of the economy, and he suggests a rule of thumb that it shouldn’t exceed the risk-free rate. We’ll use 2.5%.
Year 6 FCF = $127.6M × 1.025 = $130.8M
Terminal value = $130.8M ÷ (9% − 2.5%) = about $2,013M
Step 4: Discount to today
The discount rate is the return you require. Valuation textbooks such as Damodaran’s build it from a risk-free rate, typically a long-term government bond rate, plus a premium for risk. Riskier, less predictable businesses get a higher rate. We’ll assume 9% for Example Co.
Each future amount is divided by (1.09) raised to the number of years away:
| Year | FCF ($M) | Discount factor at 9% | Present value ($M) |
|---|---|---|---|
| 1 | 105.0 | 0.917 | 96.3 |
| 2 | 110.3 | 0.842 | 92.8 |
| 3 | 115.8 | 0.772 | 89.4 |
| 4 | 121.6 | 0.708 | 86.1 |
| 5 | 127.6 | 0.650 | 82.9 |
| Terminal value | 2,012.6 | 0.650 | 1,308.1 |
| Total business value | about 1,755.6 |
Notice that the terminal value is about 75% of the total. That’s common, and it’s why the long-term assumptions deserve the most scrutiny.
Step 5: From business value to value per share
The DCF values the whole business. Shareholders own what’s left after debt.
- Business value: $1,755.6M
- Minus net debt (debt of $300M minus cash of $100M): −$200M
- Equity value: $1,555.6M
- Divided by 50 million diluted shares
- Estimated intrinsic value: about $31 per share
Use diluted shares, which include shares that options, warrants and convertible securities could create. Using the smaller basic share count would overstate value per share. If the company is actively changing its share count, see our explainer on how stock buybacks work.
That $31 is not a target price and not a prediction of where the stock will trade. It’s the output of five assumptions we chose.
Run a sensitivity table: why small input changes swing the answer
Here’s the same model with the discount rate and long-term growth rate nudged. Values are per share, rounded.
| Discount rate ↓ / Long-term growth → | 1.5% | 2.5% | 3.0% |
|---|---|---|---|
| 8% | $32.32 | $37.57 | $40.98 |
| 9% | $27.40 | $31.11 | $33.43 |
| 10% | $23.64 | $26.38 | $28.04 |
Changing the five-year growth rate (with the 9% discount rate and 2.5% long-term growth held constant) moves it too: 3% growth gives about $28.23, 5% gives $31.11 and 7% gives $34.21.
Two percentage points of discount rate move the estimate from about $26 to about $38. Damodaran notes the same pattern: small changes in the stable growth rate can change terminal value significantly, and the effect grows as growth gets closer to the discount rate. This is why many analysts report a range rather than a single figure.
Margin of safety: what to do with an uncertain number
If the estimate could easily be off by 20% or more, how do you use it? Graham’s answer was a margin of safety: insist on a meaningful gap between your estimate of value and the price you’d pay. Buffett described it in his 1992 letter: “If we calculate the value of a common stock to be only slightly higher than its price, we’re not interested in buying.” He called the principle “the cornerstone of investment success.”
For illustration, a 25% margin of safety on a $31 estimate would mean only considering prices around $23 or less. The size of the margin is a personal choice, and many investors write theirs into an investment policy statement (see our guide to writing an investment policy statement). A margin of safety lowers the risk of overpaying; it doesn’t guarantee a gain.
Quick cross-checks: P/E and free cash flow yield
A DCF can hide a bad assumption, so many investors sanity-check it with simple ratios.
- Price-to-earnings (P/E). Price per share divided by earnings per share over the past 12 months, as Investor.gov defines it. If Example Co. earned $90M, or $1.80 per diluted share, a $31 value implies a P/E of about 17. Ask whether that multiple seems reasonable for a business with this growth and risk.
- Free cash flow yield. FCF divided by market value of the shares. If Example Co. traded at a hypothetical $40, its market value would be $2,000M and its FCF yield 5% ($100M ÷ $2,000M). Compare that yield with your discount rate and with the risk-free rate.
If the ratios and the DCF tell very different stories, recheck your inputs before trusting either.
Common mistakes
- Heroic growth. Projecting fast growth for a long time, or a terminal growth rate above the economy’s, quietly inflates value.
- Ignoring dilution. Basic share counts, or ignoring ongoing stock compensation, overstate value per share.
- Forgetting debt. Business value isn’t shareholder value until you subtract net debt.
- False precision. “$31.11” looks exact. It isn’t. Report a range.
- Working backward. Picking inputs to justify a price you already like defeats the point.
FAQ
What’s the difference between intrinsic value and market value?
Market value is what the stock trades for right now. Intrinsic value is your estimate of what the business is worth based on its future cash. The two can differ for long stretches.
What discount rate should I use in a DCF?
There’s no single correct rate. Many analysts start with a long-term government bond yield and add a risk premium that’s larger for less predictable businesses. Whatever you choose, test a range, as in the sensitivity table.
What is a margin of safety?
It’s the gap between your estimate of value and the price you’d be willing to pay. Graham emphasized it, and Buffett called it the cornerstone of investment success, because estimates can be wrong.
How did Warren Buffett calculate intrinsic value?
He has described the principle publicly rather than a formula. In Berkshire’s Owner’s Manual, intrinsic value is the discounted value of the cash a business can produce over its remaining life. In his 1986 letter, he described “owner earnings”: reported earnings plus depreciation, amortization and certain other non-cash charges, minus the capital spending needed to maintain the business’s position. He noted that last item “must be a guess.” This is historical teaching, not an endorsement of any approach.
Why do two analysts get different intrinsic values for the same stock?
Because each input is a judgment. Different growth rates, discount rates and terminal assumptions produce different values, as the table shows. Buffett makes the same point: two people will almost inevitably come up with at least slightly different figures.
Sources
- Berkshire Hathaway, An Owner’s Manual: https://www.berkshirehathaway.com/owners.html
- Berkshire Hathaway, 1986 Shareholder Letter (owner earnings): https://www.berkshirehathaway.com/letters/1986.html
- Berkshire Hathaway, 1987 Shareholder Letter (Graham’s voting and weighing machine): https://www.berkshirehathaway.com/letters/1987.html
- Berkshire Hathaway, 1992 Shareholder Letter (margin of safety): https://www.berkshirehathaway.com/letters/1992.html
- SEC, Non-GAAP Financial Measures, Corporation Finance Interpretation 102.07 (free cash flow): https://www.sec.gov/rules-regulations/staff-guidance/corporation-finance-interpretations/non-gaap-financial-measures
- SEC, Beginners’ Guide to Financial Statements: https://www.sec.gov/about/reports-publications/beginners-guide-financial-statements
- Aswath Damodaran (NYU Stern), The Stable Growth Rate: https://pages.stern.nyu.edu/~adamodar/New_Home_Page/valquestions/stablegrowthrate.htm
- Aswath Damodaran (NYU Stern), Risk Measurement and Hurdle Rates in Practice (Applied Corporate Finance, ch. 4): https://pages.stern.nyu.edu/~adamodar/pdfiles/acf3E/ch4.pdf
- Investor.gov (SEC), Price-Earnings (P/E) Ratio (glossary): https://www.investor.gov/introduction-investing/investing-basics/glossary/price-earnings-pe-ratio
- RSM US, Earnings per share (ASC 260 white paper, Nov 2023): https://www.rsmus.com/content/dam/rsm/insights/financial-reporting/1pdf/financial-reporting-insights-earnings-per-share-202311.pdf
- Example Co. figures and tables: hypothetical, calculated by The Market MBA
Keep going. This article is part of 301 Valuing a business in Level 300 Analysis and valuation of The Market MBA, a 4-level, 12-course program that ends with you writing your own investment policy statement.
For education only. Not financial, investment, legal or tax advice.
For education and entertainment only. Not financial advice.