 The Market
Key takeaways
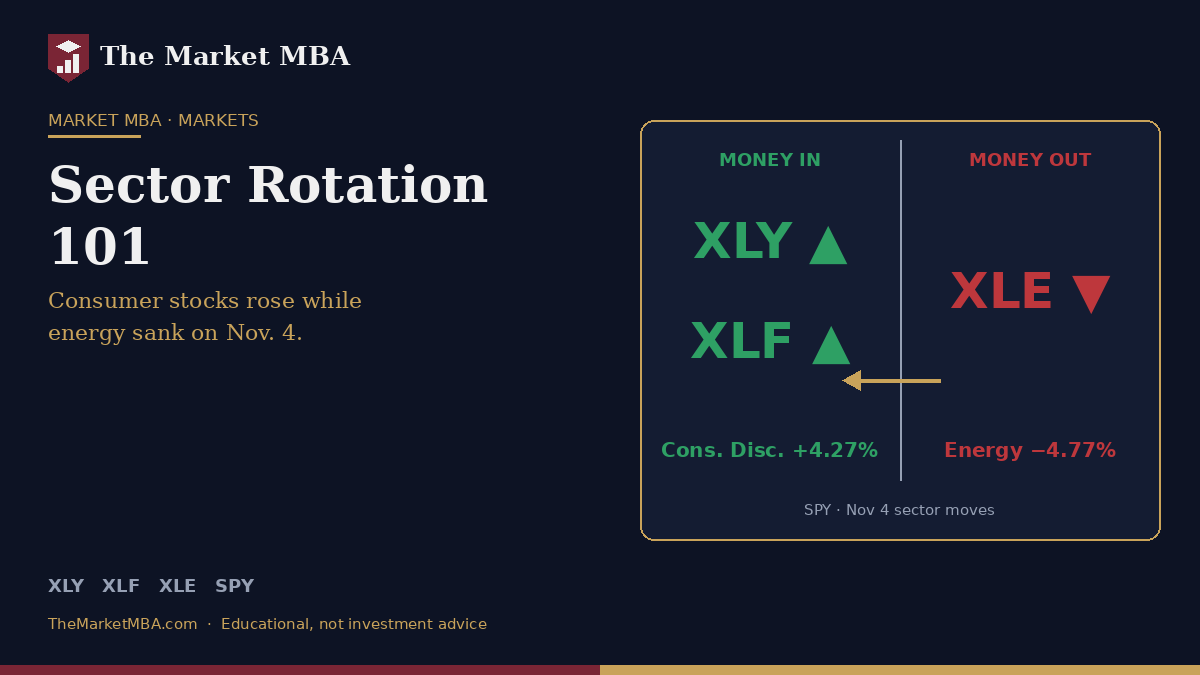
- On Nov. 4, nine of the 11 S&P 500 sectors rose. Consumer discretionary gained 4.27% and energy fell 4.77% (Xinhua).
- That kind of split is called sector rotation: investors move money out of one part of the market and into another as their view of the economy changes.
- The trigger was a sharp drop in oil prices and lower bond yields after the midterm results.
- You can follow rotation yourself using sector ETFs, funds that hold one slice of the market.
The setup: the market is really 11 markets
When people say “the market was up,” they usually mean the S&P 500, an index of about 500 large U.S. companies. But that index is divided into 11 sectors, groups of companies in similar businesses. They include technology, energy, financials, health care, consumer discretionary, consumer staples, real estate, utilities, industrials, materials and communication services.
Two of these trip up beginners:
- Consumer discretionary covers things people want but can put off: cars, restaurants, travel, online shopping. It tends to do well when shoppers feel confident.
- Consumer staples covers things people buy no matter what: groceries, toothpaste, household goods.
Each sector responds differently to the same news. Higher oil prices help oil producers but hurt airlines and shoppers. Lower interest rates help home builders and banks’ borrowers. When the outlook changes, money rotates.
What happened on Nov. 4
Democrats won both chambers of Congress in the Nov. 3 midterms. Stocks rallied broadly the next day. According to the Associated Press, the S&P 500 had its best day in three months, and the Dow Jones Industrial Average rose about 1,569 points.
The real lesson, though, was under the headline. Per Xinhua’s market close report:
- Nine of the 11 S&P 500 sectors finished higher.
- Consumer discretionary rose 4.27% and financials rose 3.46%, leading the gainers.
- Energy fell 4.77% and industrials fell 1.11%, the biggest laggards.
Reuters said consumer discretionary, financials and real estate drove the gains, while energy shares were the biggest losers.
That’s roughly a nine-percentage-point gap between the best and worst sectors in a single session. A gap that size is a textbook example of rotation.
Why it happened: follow the oil and the rates
1. Oil fell hard. Brent crude, the global oil benchmark, fell nearly 9% to settle at $94.62 a barrel, Reuters reported. Investors weighed the prospects of ending the wars in Ukraine and Iran. Reuters also noted that President Trump acknowledged the Iran war played a role in his party’s defeat. When oil drops:
- Energy companies earn less on each barrel, so their stocks fall.
- Consumers save money at the pump and have more to spend elsewhere, which helps discretionary stocks.
2. Interest rates fell. The 10-year Treasury yield, the interest rate on the government’s 10-year bond, fell about 6.6 basis points to 4.88%, according to Reuters. (A basis point is one-hundredth of a percentage point, so 6.6 basis points is 0.066%.) Lower rates make borrowing cheaper. That tends to help real estate, which relies heavily on debt, and companies that sell big-ticket items on credit.
3. Less uncertainty. “Markets hate uncertainty,” Clayton Allison, portfolio manager at Prime Capital Financial, told Reuters. “The markets love to see that there is a resolution to a catalyst event.” Once a big unknown is resolved, investors are often willing to move back into economically sensitive sectors.
How to see rotation yourself: sector ETFs
An ETF (exchange-traded fund) is a basket of investments that trades on an exchange like a single stock. A sector ETF holds the companies in one sector, so its price shows how that slice of the market is doing. Widely followed examples from State Street’s Select Sector SPDR family include:
| Sector | Example ETF |
|---|---|
| Consumer discretionary | $XLY |
| Financials | $XLF |
| Energy | $XLE |
| Technology | $XLK |
| Real estate | $XLRE |
| Consumer staples | $XLP |
Compare a sector ETF’s daily move with the S&P 500 (for example $SPY) and you’ll see which sectors are leading and which are lagging. Watch that over weeks, not one day, and you’re watching rotation.
Why it matters, and the caution that comes with it
The lesson: a single headline number can hide two very different stories. On Nov. 4, someone who owned only energy stocks had a painful day while the overall market rallied. That’s why diversification (spreading money across sectors) matters. No single sector wins every environment.
The caution: one day is not a trend. Rotation driven by a news shock can reverse quickly. If oil prices jump again, for example on renewed conflict, energy could lead and consumer stocks could lag. Chasing yesterday’s winning sector is how many investors end up buying high. Our piece Why the Hottest Stocks Fall the Hardest covers that trap. For a look at the tech side of this same day, see The AI Trade Didn’t Crash on Election Day. It Split.
A healthier way to use sector data is as a thermometer. It tells you what the market believes about oil, rates and consumers right now. It’s not a signal to trade on.
What to watch next
- Oil prices: whether Brent stays below $100 or rebounds will drive the energy vs. consumer trade.
- Fri, Nov. 6 jobs report and Tue, Nov. 10 inflation (CPI) report: both can move interest rates, and with them real estate, financials and growth stocks.
- Follow-through: do $XLY and $XLF keep outperforming $XLE over the next few weeks, or does the gap close?
- Treasury yields: a renewed rise in the 10-year yield would pressure rate-sensitive sectors.
Sources
- Xinhua, “U.S. stocks close higher” (Nov. 4, 2026): https://english.news.cn/20261105/906833b4c13b440193fa7167969dc792/c.html
- Reuters via Yahoo Finance, “World shares advance as Democrats’ victory eases political uncertainty” (Nov. 4, 2026): https://finance.yahoo.com/markets/stocks/articles/us-stock-futures-dip-investors-010842458.html
- Associated Press, “Stocks surge, and the Dow soars 1,500 points as oil prices tumble following the US midterm elections” (Nov. 4, 2026): https://apnews.com/article/stock-markets-ai-earnings-oil-4d12764c0b3ce38ffde3077712811182
https://MrFlourishinvests.com (in BETA)
https://TheMarketMBA.com (in BETA)
This article is for educational purposes only and is not financial advice. Do your own research or consult a licensed professional before investing. Not financial, investment, legal, or tax advice.
For education and entertainment only. Not financial advice.