 The Market
By Chief Editor Clark for The Market MBA
Wholesale inflation came in a little cooler than forecast on Friday. That is the headline. The more useful lesson is underneath it: the Producer Price Index (PPI) also shows what businesses are paying for raw materials and parts further back in the supply chain, and that part of the report is still running very hot. Here is how to read it.
What was reported
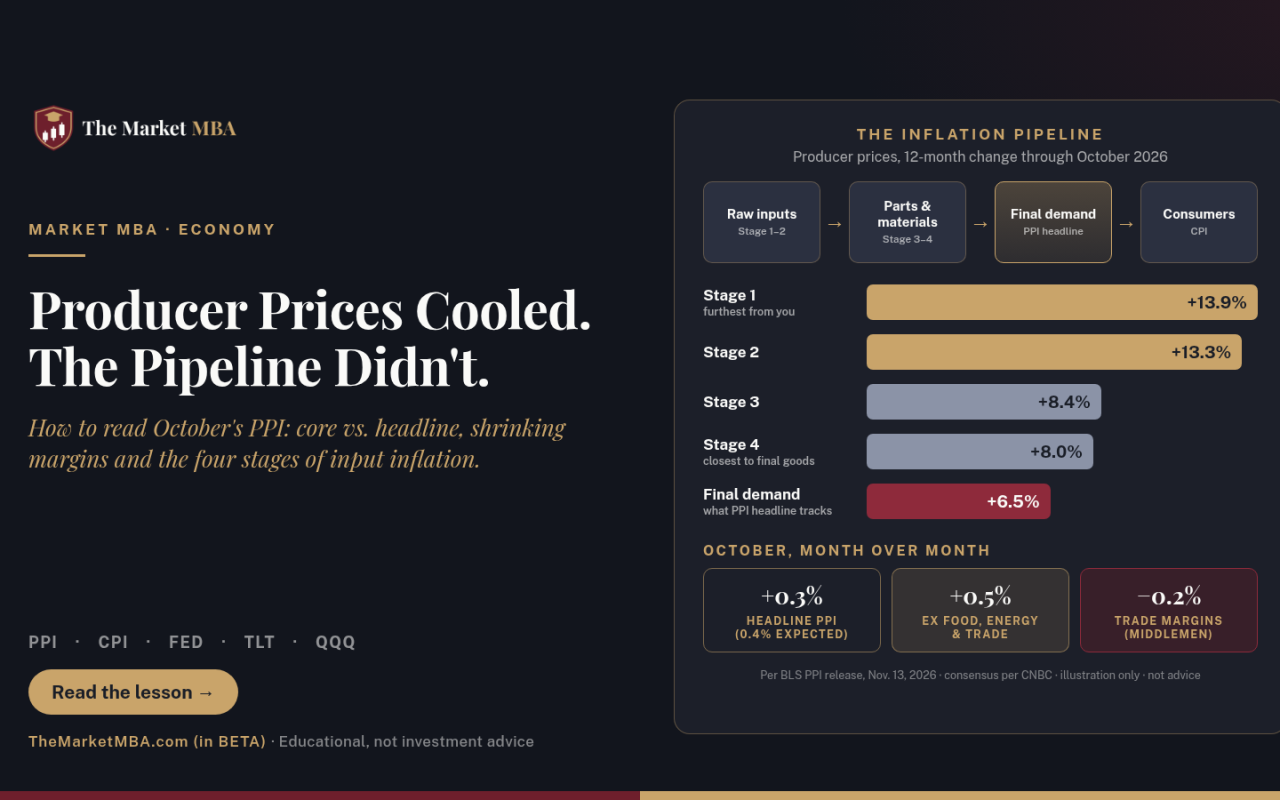
The PPI for final demand rose 0.3% in October, seasonally adjusted, the Bureau of Labor Statistics said. That followed a 1.4% jump in September and 0.4% in August. Over the 12 months through October, the index rose 6.5% (not seasonally adjusted), the largest annual increase since November 2022 (BLS).
Economists expected 0.4%, so the monthly number was a small downside surprise (CNBC; Reuters via U.S. News). Core PPI, which strips out food and energy, rose 0.3%, in line with forecasts, according to CNBC. Stock futures added to their gains after the release (CNBC).
Lesson 1: PPI is the seller’s side of the receipt
The Consumer Price Index (CPI) measures what shoppers pay. The PPI measures what domestic producers receive when they sell, often in the first business-to-business sale (BLS). Because businesses tend to pass cost increases along over time, investors watch PPI as an early read on where consumer prices could go next. It is not a perfect forecast, since companies can also absorb costs in their profit margins.
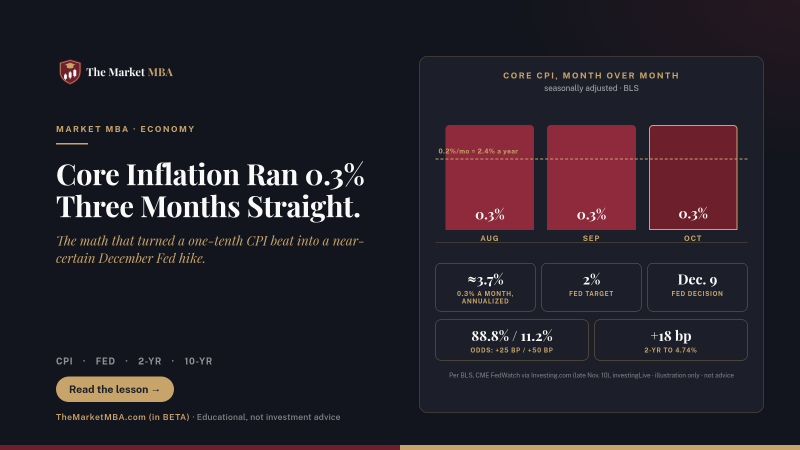
That matters this month. October CPI, released Tuesday, rose 0.4% on the headline and 0.3% at the core, each 0.1 point hotter than expected (CNBC). We walked through what three straight 0.3% core readings mean for a Fed hike in Wednesday’s lesson.
Lesson 2: Read the parts, not just the total
The total hides a split. Prices for final demand goods rose 0.5% and services rose 0.2% (BLS). Inside goods, food jumped 1.3% while energy edged down 0.1% after a 10.0% surge in September. Diesel fuel fell 7.9% in October, but basic organic chemicals rose 3.9%. Over 12 months, goods prices are up 10.2%, the most since October 2022 (BLS).
Services rose for a fifth straight month. Three-fourths of that rise came from transportation and warehousing, and more than 80% of it traced to a 3.9% jump in truck freight prices (BLS; AJOT). Freight is a cost almost every physical product carries, so it tends to spread.
Then there is the measure many economists prefer: final demand less foods, energy and trade services. It rose 0.5% in October, the same as September, and is up 4.9% over 12 months (BLS). It removes the most volatile pieces, so it gives a cleaner look at underlying pressure. On that measure, October was not a cool month.
Lesson 3: “Trade services” are margins, and they shrank
Here is a quirk that trips up new readers. In the PPI, “trade services” are not a product. They measure the margins wholesalers and retailers earn, roughly what they sell an item for minus what they paid for it. In October, final demand trade margins fell 0.2% (BLS). Machinery and vehicle wholesaling margins alone dropped 4.2%.
Why does that matter to investors? A falling margin while input costs rise means the middlemen absorbed part of the increase instead of passing it on. That held the headline down this month. It is also a profit squeeze, which shows up later in the earnings of distributors and retailers. Companies can only absorb costs for so long before they raise prices or report thinner profits.
Lesson 4: Follow the pipeline from raw material to finished good
The BLS also tracks “intermediate demand,” what businesses pay for the inputs they use to make other things. It sorts them into four stages, from Stage 1 (furthest from the consumer) to Stage 4 (closest). Price pressure usually moves down that chain over months.
Right now the early stages are far hotter than the finished goods. Over 12 months, Stage 1 prices are up 13.9% and Stage 2 prices are up 13.3%, versus 8.4% for Stage 3 and 8.0% for Stage 4 (BLS). Processed goods for intermediate demand are up 14.6%, the largest annual rise since July 2022. Services businesses buy from each other are up 6.8%, the most since November 2022 (BLS).
There is a partial offset. Unprocessed goods prices fell 3.1% in October, led by a 7.7% drop in unprocessed energy and a 10.3% fall in crude oil, and Stage 2 prices slipped 0.2% for the month (BLS). If cheaper oil holds, some of the early-stage pressure could ease before it reaches shelves. If it does not, the 13% to 14% input inflation at the top of the pipeline is a warning for consumer prices in the months ahead.
What it means for the Fed and markets
The report is unlikely to change December. Markets still fully price at least a quarter-point rate hike at the Fed’s Dec. 8–9 meeting, with small odds of a half point (CNBC). Reuters said the data support expectations that the Fed could keep raising rates after next month (Reuters via U.S. News).
Chicago Fed President Austan Goolsbee told CNBC on Friday that inflation is showing up even “in categories that are not driven by oil prices and not driven by tariffs,” with progress stalled “and in some cases going the wrong way” (CNBC). That is the pipeline problem in plain language. For rate-sensitive assets such as long-term Treasuries (TLT) and growth stocks (QQQ), the key question is whether hikes stop after December, not whether one happens.
What to watch
- Dec. 8–9: the Fed’s next meeting. A hike is fully priced, so the message about 2027 matters more than the decision.
- Dec. 15: November PPI (BLS). It arrives after the Fed meets, so the Fed will decide without it.
- Oil and diesel: October’s declines in crude and diesel are the main force that could cool the early pipeline.
- Margins in earnings: listen for retailers and distributors describing costs they could not pass on. Shrinking trade margins in the PPI are an early hint.
The bottom line
October’s 0.3% headline was a small relief, but it came partly from middlemen eating costs and a dip in fuel. Underneath, the cleaner core measure rose 0.5% for a second month, and input prices at the start of the supply chain are up 13% to 14% from a year ago. When you read a PPI report, look past the headline to the pipeline. That is where next year’s inflation starts.
Sources
- BLS: Producer Price Indexes, October 2026 news release (Nov. 13)
- BLS: Producer Price Index program overview
- CNBC: Wholesale prices rose 0.3% in October, putting annual rate at 6.5% (Nov. 13)
- Reuters via U.S. News: US producer prices rise further in October (Nov. 13)
- AJOT: US producer prices rise 0.3% in October as freight trucking costs climb (Nov. 13)
- The Market MBA: Core inflation has run 0.3% three months straight (Nov. 11)
Not financial advice. This article is for educational purposes only. Nothing here is a recommendation to buy or sell any security.
For education and entertainment only. Not financial advice.