 The Market
By Clark Kent for The Market MBA
Prices as of 1:00 p.m. CT, Thursday, Nov. 5, 2026, during regular trading (Robinhood market data). Markets were open and moving fast; check a live quote before relying on any figure.
Key takeaways
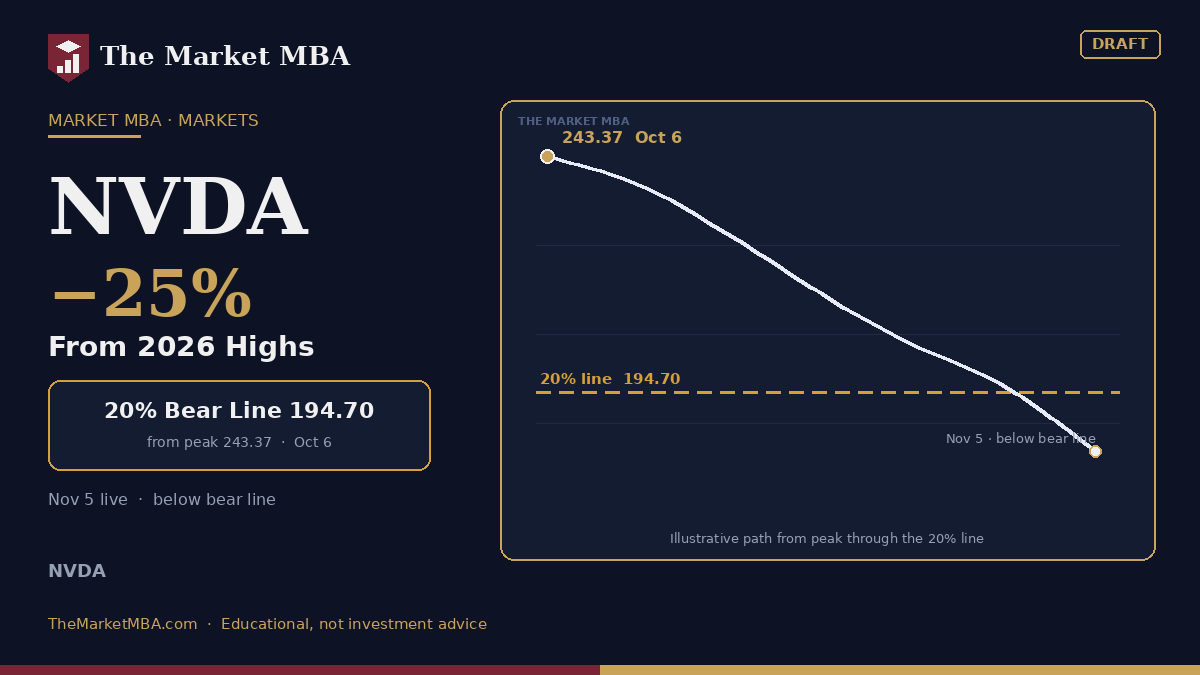
- Nvidia closed Wednesday at $200.13, down 17.8% from its Oct. 6 intraday high of $243.37. The textbook 20% “bear market” line from that high is $194.70, about 3% below Wednesday’s close.
- Thursday the stock opened at $196.08 and fell through that line within minutes. At 1:00 p.m. CT it traded at $183.09, down 8.5% on the day and about 24.8% below the high.
- Whether it “counts” depends on definitions: intraday vs. closing prices, and which peak you measure from.
- A bear market is a label for a price decline, not a verdict on the business. The next hard data point is Nvidia’s Nov. 17 earnings report.
From “3% away” to through the line in one morning
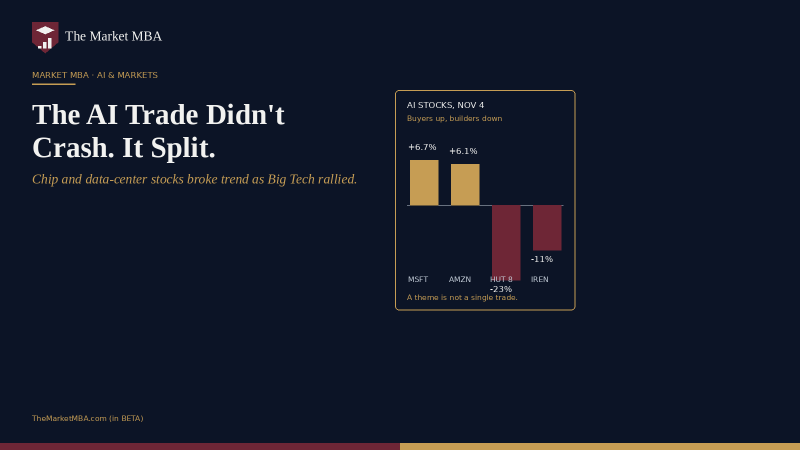
On Wednesday’s close, Nvidia (NVDA) sat about $5.43 above the 20% line. Thursday erased that cushion fast. The Associated Press described “another wipeout for stocks tied to the buildout of AI data centers,” with the S&P 500 down 3.5% as of 12:26 p.m. ET. The Nasdaq-100 tracker QQQ was down about 5.8% at our timestamp. (We covered the post-election backdrop in The AI Trade Didn’t Crash on Election Day. It Split.. This piece is about the line itself.)
Intraday vs. close: why the definition matters
A bear market is commonly defined as a drop of 20% or more from a peak. That sounds precise until you ask, “Which peak?”
- Nvidia’s intraday high on Oct. 6 was $243.37. Measured from there, the 20% line is $194.70.
- Its closing price that day was $239.24. Measured from the close, the 20% line is lower, at $191.39.
Many market-history counts use closing prices, because the close is the price funds use to value their holdings. As of midday Thursday, Nvidia was below both lines. A close below $194.70 would put the stock past the threshold on any common definition. The official close is at 3 p.m. CT.
The 200-day moving average: a line that’s already been whipsawed
The 200-day moving average is the average closing price over the past 200 trading days. Traders use it as a rough read on the long-term trend. StockAnalysis put Nvidia’s at about $204.67 as of Nov. 4. Other data providers differ slightly.
The recent closes show why one crossing isn’t a final verdict:
- Oct. 30: $204.64, essentially on the line
- Nov. 2: $202.06, below
- Nov. 3: $206.69, back above
- Nov. 4: $200.13, below again
Thursday’s 1 p.m. price was about 10.5% under the average, a much clearer gap. But the past week shows that a stock can lose this line, win it back and lose it again within days. Treat it as a gauge of the trend, not a permanent break.
Four losing weeks, not five (yet)
You may see “five straight losing weeks.” Here’s the careful version. Nvidia has posted four completed down weeks: the Friday closes on Oct. 9, 16, 23 and 30 each came in below the week before. This week is down about 10.5% so far versus Oct. 30’s $204.64 close. It only becomes a fifth losing week if Friday, Nov. 6, closes below $204.64. Some data sites count a partial week as a full one, so read the fine print.
“Cheap” depends on who’s counting
Forward P/E is the share price divided by analysts’ expected earnings per share over the next 12 months. S&P Global data on StockAnalysis showed Nvidia at 16.55x forward earnings, based on Wednesday’s $200.13 close. That figure belongs to one vendor. Others use different estimates and time windows and get different numbers. And when the price falls 8% in a day, the multiple shrinks with it, even if nothing about the business has changed. A low multiple only means something if the earnings forecasts behind it hold up.
Apple’s crown, again
Apple (AAPL) and Nvidia have repeatedly traded places as the world’s most valuable public company in recent weeks. Apple moved ahead around the Oct. 30 close, FinanceNewsInt reported. Nvidia took the top spot back on Nov. 3, Forbes Middle East reported. Apple regained it on Nov. 4, per Reuters. Using Robinhood’s share counts and prices at our timestamp, Apple was worth about $5.01 trillion and Nvidia about $4.50 trillion. Rankings can flip within days. They make for a catchy headline, but they don’t make an investment case. (For Apple’s latest quarter, see our earnings breakdown.)
The date that matters: Nov. 17
Nvidia’s investor-relations site confirms the company will report fiscal third-quarter 2027 results (quarter ended Oct. 25) on Tuesday, Nov. 17. The conference call is at 2 p.m. PT / 5 p.m. ET. In August, the company guided to $108.0 billion in revenue, plus or minus 2%, and a gross margin of about 74.0%. That outlook assumed no data-center compute revenue from China. Aggregator MarketBeat lists the consensus estimate at about $2.47 per share on $108.8 billion of revenue.
Things worth watching, regardless of where the stock trades:
- Revenue and gross margin compared with the company’s own guidance
- The outlook for the January quarter
- What management says about demand from large customers and supply constraints
The lesson
The 20% line is a definition, not a forecast. Crossing it doesn’t tell you what happens next. It tells you how far the price has already fallen. Big winners can fall hard and fast (see Why the Hottest Stocks Fall the Hardest). Before reacting to a label, ask yourself a few questions. Does the business still match the reason you own it? Is your position sized so a 25% drop doesn’t force a decision? And is your time horizon measured in days or in years?
Sources
- Robinhood market data: NVDA, AAPL, QQQ quotes, intraday bars, 52-week high and share counts (accessed Nov. 5, 2026, 1:00 p.m. CT); historical closes for Oct. 6–Nov. 4
- NVIDIA Investor Relations, “NVIDIA Sets Conference Call for Third-Quarter Financial Results” (Oct. 28, 2026): https://investor.nvidia.com/news/press-release-details/2026/NVIDIA-Sets-Conference-Call-for-Third-Quarter-Financial-Results/default.aspx
- NVIDIA Newsroom, Q2 fiscal 2027 results and outlook: https://nvidianews.nvidia.com/news/nvidia-announces-financial-results-for-second-quarter-fiscal-2027
- StockAnalysis (S&P Global Market Intelligence data), NVDA statistics: https://stockanalysis.com/stocks/nvda/statistics/
- MarketBeat, NVDA Q3 FY2027 earnings estimates: https://www.marketbeat.com/earnings/reports/2026-11-17-nvidia-co-stock/
- Associated Press, “Wall Street reels from AI sell-off” (Nov. 5, 2026): https://apnews.com/article/stocks-markets-ai-midterm-oil-trump-7ee9c212805aa5e70cf34d25aab7a36e
- Reuters via TradingView, “Apple surpasses Nvidia in market cap to take lead” (Nov. 4, 2026): https://www.tradingview.com/news/reuters.com,2026:newsml_L6N46L1CC:0-apple-surpasses-nvidia-in-market-cap-to-take-lead/
- FinanceNewsInt, “Apple overtakes Nvidia as world’s most valuable company at $5.03 trillion” (Nov. 2, 2026): https://www.financenewsint.com/articles/apple-overtakes-nvidia-as-world-s-most-valuable-company-at-5-03-trillion
- Forbes Middle East, “Nvidia regains title of world’s most valuable company” (Nov. 3, 2026): https://www.forbesmiddleeast.com/money/markets/nvidia-regains-title-of-worlds-most-valuable-company-as-apple-shares-slide-1
https://MrFlourishinvests.com (in BETA)
https://TheMarketMBA.com (in BETA)
This article is for educational purposes only and is not financial advice. Do your own research or consult a licensed professional before investing.
For education and entertainment only. Not financial advice.