 The Market
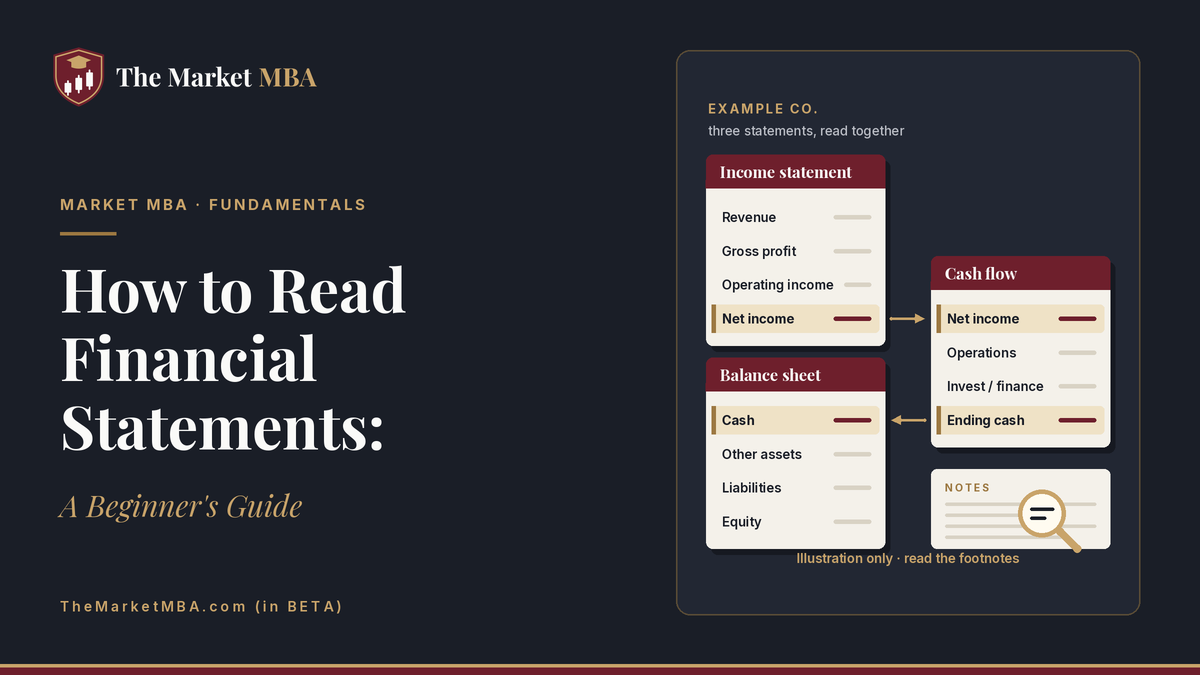
Read the three statements together. The income statement shows revenue, costs and profit over a period. The balance sheet shows what the company owns and owes on one date. The cash flow statement shows the cash that actually came in and went out. Compare several years, check that profit turns into cash, and read the footnotes.
You don’t need an accounting degree to read financial statements as an investor. You need to know where to look, what each statement answers, and a handful of questions to ask. We’ll walk through all three using one hypothetical company, Example Co., with round numbers.
Where to find a company’s financial statements (10-K, 10-Q, SEC EDGAR)
US public companies file their financials with the Securities and Exchange Commission. Two filings matter most:
- Form 10-K: the annual report. Its audited financial statements sit in Item 8, and management’s own explanation of the results, the MD&A (Management’s Discussion and Analysis), is Item 7.
- Form 10-Q: the quarterly report, filed after each of the first three fiscal quarters. Its statements are shorter and may be unaudited, though an independent accountant reviews them.
Every filing is free on the SEC’s EDGAR database (sec.gov/edgar), and most companies also post them on their investor-relations pages. Depending on company size, a 10-K is due 60 to 90 days after the fiscal year ends.
US companies prepare these statements under Generally Accepted Accounting Principles (GAAP), and an independent auditor audits the annual statements. There’s actually a fourth statement too, the statement of shareholders’ equity, but the three below do most of the work.
The income statement: is the business profitable?
The income statement (also called the statement of operations or earnings) covers a period, such as a year or quarter. Here’s Example Co.’s year:
| Example Co. income statement | $ millions |
|---|---|
| Revenue | 1,000 |
| Cost of goods sold | (600) |
| Gross profit | 400 |
| Operating expenses (salaries, rent, marketing, R&D) | (250) |
| Operating income | 150 |
| Interest expense | (20) |
| Income taxes | (30) |
| Net income | 100 |
| Diluted shares outstanding | 50 million |
| Diluted EPS | $2.00 |
Revenue → gross profit → operating income → net income → EPS
Read it top to bottom, asking a question at each line:
- Revenue: how much did customers pay? Is it growing?
- Gross profit ($400M, a 40% gross margin): how much is left after the direct cost of the product? Many analysts read high, stable gross margins as a possible sign of pricing power.
- Operating income ($150M, a 15% operating margin): what does the core business earn after running costs, before financing and taxes?
- Net income ($100M): the bottom line, after interest and taxes.
- Earnings per share (EPS): net income divided by shares. “Diluted” EPS also counts shares that options, warrants and convertible securities could create, so it’s usually the more conservative figure.
The balance sheet: what it owns, what it owes
The balance sheet is a snapshot on one date, usually the last day of the fiscal year.
| Example Co. balance sheet (year end) | $ millions |
|---|---|
| Cash | 100 |
| Receivables (money customers owe) | 150 |
| Inventory | 150 |
| Current assets | 400 |
| Property, plant and equipment | 700 |
| Other long-term assets | 100 |
| Total assets | 1,200 |
| Current liabilities (bills due within a year) | 250 |
| Long-term debt | 450 |
| Total liabilities | 700 |
| Shareholders’ equity | 500 |
Assets = liabilities + shareholders’ equity
That equation always holds: $1,200M = $700M + $500M. Everything the company owns was paid for either with money it owes (liabilities) or with owners’ money and profits kept over the years (equity).
Current vs long-term items
Current assets are expected to turn into cash within a year; current liabilities are due within a year. Example Co. has $400M of current assets against $250M of current liabilities, so it can cover near-term bills. Compare long-term debt ($450M) with yearly operating income ($150M) to get a feel for how heavy the debt is.
The cash flow statement: does profit turn into cash?
Profit is an accounting measure. Cash is what pays bills, dividends and debt. The cash flow statement reconciles the two.
| Example Co. cash flow statement | $ millions |
|---|---|
| Net income | 100 |
| Add back depreciation (a non-cash expense) | 60 |
| Increase in receivables and inventory | (20) |
| Cash from operating activities | 140 |
| Capital expenditures | (80) |
| Cash from investing activities | (80) |
| Debt repaid | (30) |
| Dividends paid | (20) |
| Cash from financing activities | (50) |
| Net change in cash | +10 |
Operating, investing, financing
- Operating: cash the core business generated. Here it’s $140M, higher than net income, which is a healthy sign.
- Investing: money spent on (or received from) long-term assets such as equipment, acquisitions and investments.
- Financing: money exchanged with lenders and owners, including borrowing, repaying debt, issuing or buying back stock, and paying dividends.
Free cash flow (simple version)
Free cash flow = cash from operations − capital expenditures. For Example Co., $140M − $80M = $60M. That’s the cash left over that the company could use to pay dividends, cut debt, buy back shares or reinvest. Free cash flow isn’t a GAAP line item, so companies define it in different ways. Check how they calculate it.
How the three statements connect
The statements are one system, not three separate reports:
Net income (income statement) → starts the cash flow statement → net change in cash updates the cash line on the balance sheet. Net income minus dividends adds to retained earnings, part of shareholders’ equity.
For Example Co., cash rose $10M, so the balance sheet’s cash line grew from $90M to $100M. And $80M of profit ($100M − $20M of dividends) was kept, adding to equity. If the numbers don’t tie together in a filing, that’s worth asking about.
A 10-minute first read: 6 things to check
- Trend in revenue. Look at three to five years, not one. Is growth steady, lumpy or shrinking?
- Margins. Are gross and operating margins stable, rising or falling?
- Cash vs profit. Over several years, is operating cash flow roughly in line with net income or above it? Profit that never turns into cash deserves a closer look.
- Debt. Is debt rising faster than operating income? When is it due?
- Share count. Is the diluted share count creeping up from stock-based pay, or falling from buybacks? See our explainer on how stock buybacks work.
- Footnotes and MD&A. The notes explain accounting policies, debt terms and one-time items. The MD&A is management’s explanation of what drove results and which risks they see.
These are signals to investigate, not buy or sell triggers.
Common beginner mistakes
- Reading one year in isolation. A great year can be a fluke, and a bad one can be a one-off. Trends tell the story.
- Ignoring dilution. If net income grows 10% but the share count grows 8%, each share’s slice barely moved. Watch EPS and the share count, not just total profit.
- Treating adjusted numbers as gospel. Companies often highlight “adjusted” or non-GAAP figures that strip out certain costs. SEC rules require them to show the closest GAAP measure and reconcile the two. Read the reconciliation and decide for yourself whether the excluded costs are really one-time.
FAQ
What are the three main financial statements?
The income statement (profit over a period), the balance sheet (assets, liabilities and equity on one date) and the cash flow statement (cash in and out over a period). A fourth, the statement of shareholders’ equity, tracks changes in owners’ equity.
Which financial statement is most important for investors?
None works alone; as the SEC’s guide puts it, no one financial statement tells the complete story. Some investors start with the cash flow statement because it shows whether the company actually generated cash, then use the income statement and balance sheet to understand why.
How do you read a 10-K?
Start with Item 1 (Business) to learn what the company does, then Item 1A (Risk Factors), Item 7 (MD&A) and Item 8 (Financial Statements and notes). Compare the numbers with prior years. The auditor’s report, also in the 10-K, tells you whether the auditor raised any concerns.
What’s the difference between net income and free cash flow?
Net income is accounting profit, which includes non-cash items like depreciation. Free cash flow is operating cash flow minus capital spending: the actual cash left after maintaining and growing the business. The two can differ a lot in any given year.
What are red flags in financial statements?
Warning signs analysts commonly look for include profit that consistently outpaces operating cash flow, receivables or inventory growing much faster than revenue, rising debt with flat earnings, a steadily growing share count, frequent “one-time” charges, and a change of auditors (companies must disclose one on Form 8-K, Item 4.01) or an auditor’s report that isn’t a clean opinion. Treat each as a reason to dig deeper, not a verdict.
Sources
- SEC, Beginners’ Guide to Financial Statements: https://www.sec.gov/about/reports-publications/beginners-guide-financial-statements
- Investor.gov (SEC), How to Read a 10-K/10-Q: https://www.investor.gov/introduction-investing/general-resources/news-alerts/alerts-bulletins/investor-bulletins/how-read
- Investor.gov (SEC), How to Read an 8-K: https://www.investor.gov/introduction-investing/general-resources/news-alerts/alerts-bulletins/investor-bulletins/how-read-8
- Form 10-K General Instructions, filing deadlines (17 CFR 249.310): https://www.law.cornell.edu/cfr/text/17/249.310
- Regulation S-X Rule 10-01, Interim financial statements (17 CFR 210.10-01): https://www.ecfr.gov/current/title-17/section-210.10-01
- Regulation G, non-GAAP financial measures (17 CFR 244.100): https://www.ecfr.gov/current/title-17/chapter-II/part-244/section-244.100
- Investor.gov (SEC), Earnings Per Share (glossary): https://www.investor.gov/introduction-investing/investing-basics/glossary/earnings-share
- RSM US, Earnings per share (ASC 260 white paper, Nov 2023): https://www.rsmus.com/content/dam/rsm/insights/financial-reporting/1pdf/financial-reporting-insights-earnings-per-share-202311.pdf
Keep going. This article is part of 110 Reading financial statements in Level 100 Foundations of The Market MBA, a 4-level, 12-course program that ends with you writing your own investment policy statement. Next, put these numbers to work in our beginner’s guide to calculating a stock’s intrinsic value.
For education only. Not financial, investment, legal or tax advice.
For education and entertainment only. Not financial advice.