 The Market
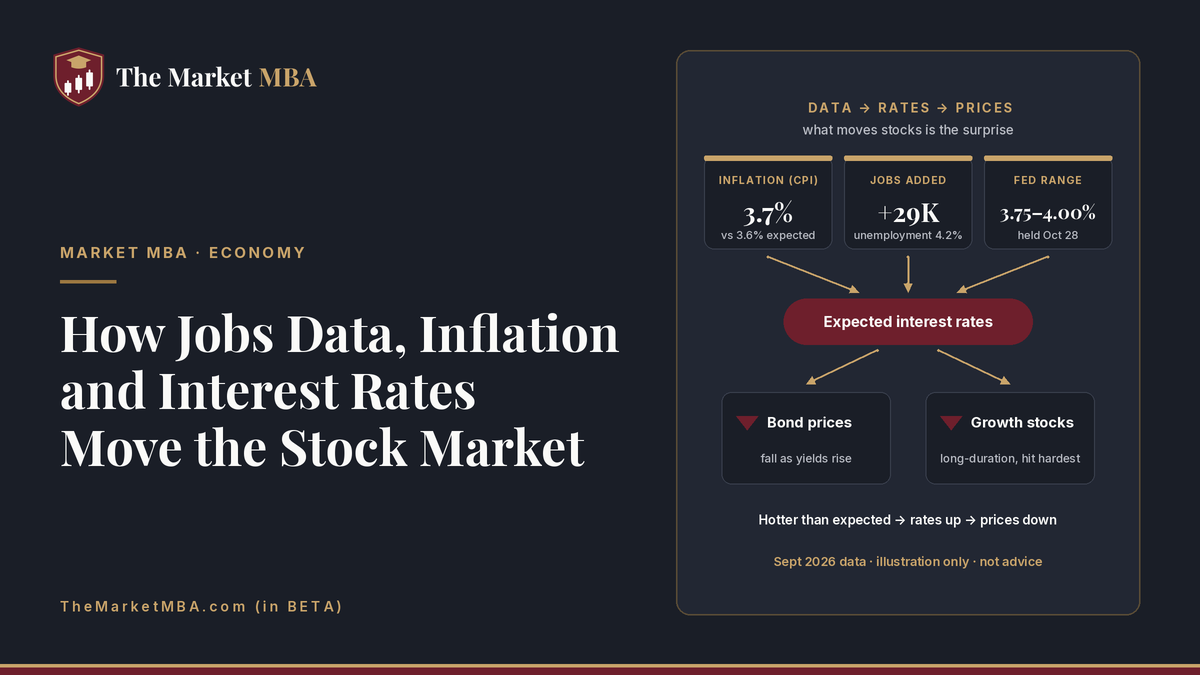
Markets don’t react to economic data because the numbers are good or bad. They react to the gap between the number and what investors expected, and to what that gap means for interest rates. Hotter-than-expected inflation or jobs data can push expected rates up and stock and bond prices down. Cooler data can do the reverse.
Most weeks have an economic release that moves the market, and this week has several. The October jobs report comes out Friday, November 6, and the October Consumer Price Index follows on Tuesday, November 10, both at 8:30 a.m. ET (BLS release calendar). This lesson explains how to read those reports the way traders do, using the latest real numbers as the example.
Step 1: Know the three numbers that matter most
1. Inflation (CPI). The Consumer Price Index measures how fast prices are rising for urban consumers. In the September 2026 CPI report released October 14, prices rose 0.6% for the month and 3.7% over 12 months, up from 3.4% in August. “Core” CPI, which strips out food and energy, rose 2.6% over the year. Gasoline jumped 9.1% in September alone and accounted for more than half of the monthly increase.
2. Jobs (the Employment Situation report). This is the monthly jobs report most people mean when they say “jobs Friday.” In the September 2026 report, employers added just 29,000 jobs, the unemployment rate was 4.2%, and average hourly earnings were up 3.0% from a year earlier. July and August were also revised down by a combined 60,000 jobs.
3. The Fed’s interest rate. The Federal Reserve sets a target range for the federal funds rate, the overnight rate banks charge each other, which ripples out to credit cards, loans and bond yields. On October 28, 2026, the Fed kept that range at 3.75% to 4.00% and said “inflation remains elevated.” Two of the twelve voters, Lisa Cook and Beth Hammack, wanted to raise rates by a quarter point. CNBC reported that the range has been at this level since the Fed raised it in September.
The Fed has two jobs set by Congress: stable prices and maximum employment (Federal Reserve). That is why inflation and jobs data matter so much. They are the scorecard the Fed uses to decide where rates go next.
Step 2: It’s the surprise, not the number
Before every major release, economists publish forecasts, and markets price those forecasts in ahead of time. When the number comes out, prices move on the difference.
Take September’s CPI. Economists surveyed by Dow Jones expected 3.6% annual inflation and a 0.2% rise in core prices for the month, according to CNBC. The actual numbers were 3.7% and 0.3%. A 0.1-point miss sounds tiny, but for a Fed already worried about inflation it is a signal that prices are not cooling as hoped.
The same logic works for jobs. Payroll growth of 29,000 would look strong in one economy and weak in another. What matters is how it compares with the forecast and with the recent trend, including revisions to earlier months.
A simple way to read any release:
| The data comes in… | What it may signal about rates | Typical first reaction |
|---|---|---|
| Inflation hotter than expected | Rates stay higher for longer, or rise | Bond prices fall, yields rise, growth stocks often fall |
| Inflation cooler than expected | Room for lower rates later | Bond prices rise, stocks often rally |
| Jobs much stronger than expected | Economy running hot, less reason to cut | Yields rise; stock reaction depends on inflation |
| Jobs much weaker than expected | Growth slowing, cuts more likely | Yields fall; stocks can rise on rates or fall on recession fears |
The “typical” column is a tendency, not a rule. Markets also weigh what’s already priced in, what the Fed has said, and everything else in the news that day.
Step 3: Follow the chain from data to prices
Here’s why a few tenths of a percent in an inflation report can move trillions of dollars of stock value.
Bonds move first. If investors expect higher rates, newly issued bonds will pay more, so existing bonds with lower coupons lose value. We walk through the math in why bond prices fall when interest rates rise.
Stocks are valued against those rates. A stock is worth the cash it will produce in the future, discounted back to today. A higher interest rate means a higher discount rate, which shrinks what those future dollars are worth now. You can see the effect yourself in our guide to calculating a stock’s intrinsic value.
Long-duration stocks feel it most. Companies whose profits are mostly far in the future, often the fastest-growing and most expensive names, are hit hardest when rates rise, for the same reason long-term bonds are. That is a big part of why the hottest stocks fall the hardest.
Step 4: Read the details, not just the headline
The headline is what moves the first few seconds. The details are what professionals argue about for the rest of the day.
- Core vs. headline inflation. In September, headline CPI was driven by energy: the energy index was up 20.4% over 12 months, while core was up 2.6% (BLS). The Fed pays close attention to the underlying trend, because energy prices can swing back.
- Revisions. The September jobs report revised August from +162,000 to +133,000 and July from +21,000 to −10,000 (BLS). A “good” new number paired with large downward revisions can be weaker than it looks.
- Wages. Average hourly earnings matter for both sides of the Fed’s mandate. Fast wage growth can feed inflation, while slow wage growth with rising prices squeezes households.
- The Fed’s own words. Changes in the statement’s wording often matter as much as the rate decision itself. In October, the Fed said it would wait for “the accumulation of more information” before deciding its next step (Federal Reserve), which left the door open in both directions.
What this means for a long-term investor
You don’t need to trade every release. But knowing the chain from data to rates to prices helps you understand why your portfolio moves on days when nothing happened to the companies you own.
A few habits help:
- Check the calendar. The BLS schedule and the Fed’s meeting calendar tell you when the big moves are likely.
- Compare to expectations, not your gut. Look up the consensus forecast before you judge a number.
- Watch what’s sensitive to rates. Bond funds, high-growth stocks and anything bought with borrowed money tend to move most when rate expectations change.
- Stay diversified. A broad, low-cost fund spreads these swings across the whole market. See our comparison of index funds and ETFs.
The bottom line
Economic data moves markets through one main channel: what it tells investors about future interest rates. Inflation running at 3.7% with the Fed’s target range at 3.75% to 4.00% and two officials already pushing for a hike is why this Friday’s jobs report and next Tuesday’s CPI could matter more than usual. Read the surprise, read the details, and follow the chain to rates.
Sources
- Federal Reserve, FOMC statement (Oct. 28, 2026): https://www.federalreserve.gov/newsevents/pressreleases/monetary20261028a.htm
- Federal Reserve, Monetary policy explained: https://www.federalreserve.gov/aboutthefed/fedexplained/monetary-policy.htm
- Federal Reserve, FOMC meeting calendar: https://www.federalreserve.gov/monetarypolicy/fomccalendars.htm
- U.S. Bureau of Labor Statistics, Consumer Price Index, September 2026: https://www.bls.gov/news.release/cpi.nr0.htm
- U.S. Bureau of Labor Statistics, The Employment Situation, September 2026: https://www.bls.gov/news.release/empsit.nr0.htm
- U.S. Bureau of Labor Statistics, release schedule, November 2026: https://www.bls.gov/schedule/2026/11_sched.htm
- CNBC, CPI report September 2026 (Oct. 14, 2026): https://www.cnbc.com/2026/10/14/cpi-inflation-report-september-2026.html
- CNBC, Fed interest rate decision October 2026 (Oct. 28, 2026): https://www.cnbc.com/2026/10/28/fed-interest-rate-decision-october-2026.html
🌐 MrFlourishinvests.com (in BETA) – Daily market moves, stock ideas, and money flow from MrFlourish and Team.
🌐 TheMarketMBA.com (in BETA) – Plain-English lessons on how markets, investing, and money really work crafted by MrFlourish and Team.
NFA
For education only. Not financial, investment, legal or tax advice.
For education and entertainment only. Not financial advice.