 The Market
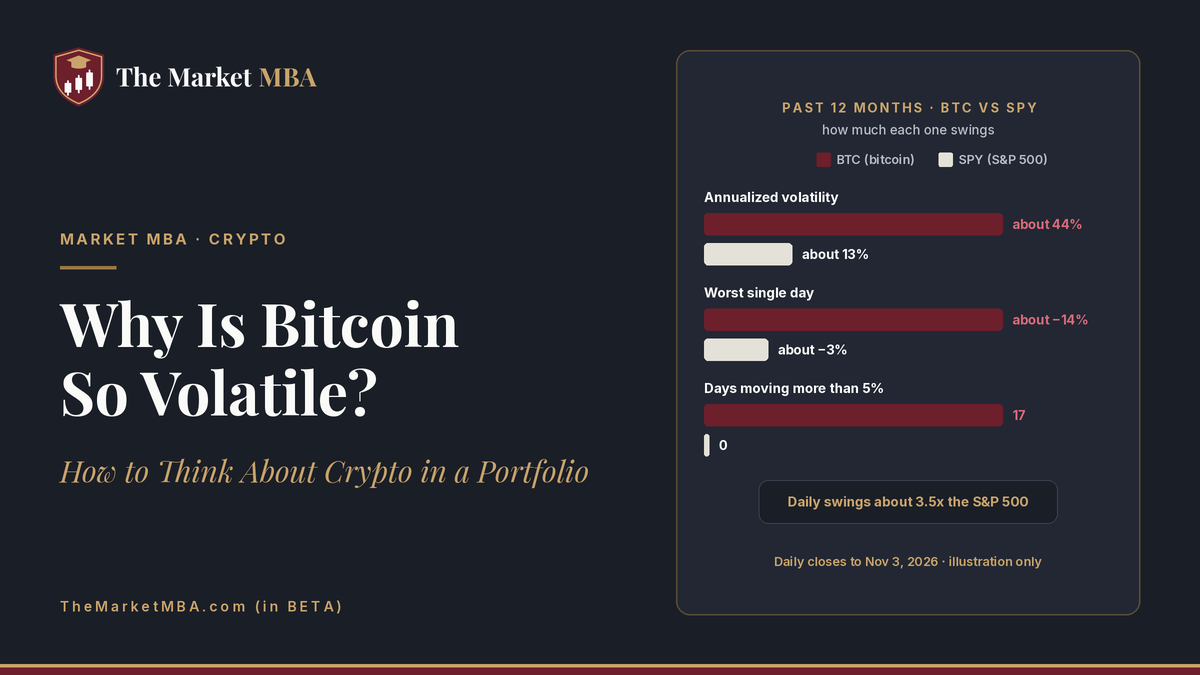
Bitcoin is volatile because its supply is fixed, nothing like earnings or dividends anchors its price, and its moves are amplified by fund flows, borrowed money and shifts in interest-rate expectations. Over the past year its daily price swings were about three and a half times as large as the S&P 500’s. If you own it, the key decision is how much, not whether it will go up tomorrow.
As of November 3, 2026, bitcoin traded near $77,600 (Yahoo Finance). It has closed below $80,000 every day since October 29, and CoinDesk reported that it dipped to around $76,300 on the morning of November 3 (CoinDesk). That’s a useful moment to explain what drives these swings and how to think about them.
Step 1: Measure the volatility
“Volatile” means prices move a lot, in both directions. Investors usually measure it as annualized volatility: the standard deviation of daily returns, scaled up to a year.
Using daily closing prices for the 12 months to November 3, 2026 (Yahoo Finance BTC-USD, Yahoo Finance SPY; our calculations):
| Measure, past 12 months | Bitcoin | S&P 500 ETF (SPY) |
|---|---|---|
| Annualized volatility | about 44% | about 13% |
| Worst single day | about −14% | about −3% |
| Days with a move larger than 5% | 17 | 0 |
| Price change over the year | about −27% | about +11% |
The range of outcomes over the past year shows the same thing. In June 2026, bitcoin fell below $60,000 and hit $59,023.98 on June 24, its lowest level since October 2024 (CNBC). At that point it was more than 50% below its October 2025 record high (CoinDesk).
Options traders expect more of the same. Implied volatility on the nearest-dated bitcoin options was about 51% on November 3, up from about 43.5% a day earlier, ahead of the US midterm elections (CoinDesk).
Step 2: Understand why it moves so much
1. Fixed supply means demand does all the work
Only 21 million bitcoins will ever be created, and new coins are issued at a predictable, declining rate (Bitcoin.org). A stock company can issue or buy back shares, and a central bank can change the money supply. Bitcoin’s supply can’t respond to demand, so every change in demand shows up in the price. Bitcoin.org’s own FAQ says the price “is still very volatile” because “it doesn’t take significant amounts of money to move the market price up or down.”
2. Nothing anchors the value
A stock is a claim on a company’s future cash flows, which you can estimate (see how to calculate the intrinsic value of a stock). A bond pays interest. Bitcoin pays no cash, so there’s no earnings report or dividend to pull its price back toward a “fair value.” Its price is set by what the next buyer is willing to pay. When the SEC approved spot bitcoin exchange-traded products in January 2024, its chair called bitcoin “primarily a speculative, volatile asset” (SEC).
3. Fund flows push the price
Spot bitcoin ETFs let investors buy bitcoin exposure in a brokerage account (see index funds vs. ETFs for how ETFs work). When money leaves those funds, they can sell bitcoin. US spot bitcoin ETFs lost $643.33 million on October 30 and $398.62 million on November 2, more than $1.04 billion over two sessions. BlackRock’s IBIT accounted for $405.30 million of the November 2 outflow (Bitcoin.com News, citing SoSoValue; Farside Investors flow data). Deutsche Bank analysts said bitcoin’s price is now “set by fund flows, Fed expectations, competing risk themes, and legislative outcomes” (CoinDesk).
4. Leverage turns dips into drops
Much crypto trading uses borrowed money through futures. When prices fall, leveraged positions get closed automatically, which forces more selling. CoinDesk reported $382.6 million of crypto liquidations in 24 hours on November 3 (CoinDesk).
5. Interest rates matter here too
When investors expect higher rates, speculative assets with no cash flows tend to suffer, just as long-duration growth stocks do (see why the hottest stocks fall the hardest). Deutsche Bank cited a hawkish shift in Federal Reserve expectations as one driver of bitcoin’s June slide (CoinDesk). The same logic shows up in bonds: see why bond prices fall when interest rates rise.
Step 3: Think in position size, not predictions
No one can reliably predict bitcoin’s next move. What you control is how much of your portfolio is exposed to it. Here’s a simple illustration (our arithmetic, not a recommendation):
| Share of portfolio in bitcoin | If bitcoin falls 50% | Portfolio impact (crypto part only) |
|---|---|---|
| 1% | −50% | −0.5% |
| 5% | −50% | −2.5% |
| 20% | −50% | −10% |
| 50% | −50% | −25% |
A 50% drop isn’t a far-fetched scenario. Bitcoin was more than 50% below its peak as recently as June 2026 (CoinDesk). A useful question: how much could this holding fall before you’d be forced, or tempted, to sell at the bottom? Size it so the answer is “I’d hold.”
A few principles investors use:
- Treat it as the high-risk part of a portfolio. Many investors keep any crypto to a small slice, sized so a large drop wouldn’t derail their goals.
- Rebalance with rules. A volatile asset can grow from 5% to 15% of a portfolio quickly, and then shrink just as fast. Setting a target and rebalancing back to it keeps risk in check.
- Know what you own and who holds it. Holding an ETF in a brokerage account is different from holding coins on an exchange or in your own wallet. Each has its own risks, fees and protections. The SEC’s investor education site has a crypto assets overview.
- Watch the drivers, not just the price. ETF flows, leverage and Fed expectations explain a lot of the short-term swings.
The bottom line
Bitcoin’s volatility isn’t a glitch. It comes from a fixed supply, no cash flows to anchor value, and a market moved by fund flows, leverage and interest rates. Over the past year it moved roughly three and a half times as much as the S&P 500. Whatever you think of its long-term future, the practical lesson is the same: decide how big a loss you can live with, and size your position to match.
Sources
- Yahoo Finance, BTC-USD price history: https://finance.yahoo.com/quote/BTC-USD/history/
- Yahoo Finance, SPY price history: https://finance.yahoo.com/quote/SPY/history/
- CoinDesk, “Bitcoin steadies after dip to $76,300 as ETF outflows and midterm elections weigh on crypto” (Nov. 3, 2026): https://www.coindesk.com/markets/2026/11/03/bitcoin-steadies-after-dip-to-usd76-300-as-etf-outflows-and-midterm-elections-weigh-on-crypto
- Bitcoin.com News, “Bitcoin ETFs Lose $399M as 2-Day Outflows Top $1.04B” (Nov. 3, 2026): https://news.bitcoin.com/bitcoin-etf/bitcoin-etfs-lose-399m-as-2-day-outflows-top-1-04b/
- Farside Investors, bitcoin ETF flows: https://farside.co.uk/btc/
- CNBC, “Bitcoin falls back under $60,000, hitting its lowest level since October 2024” (June 24, 2026): https://www.cnbc.com/2026/06/24/bitcoin-falls-back-under-60000-hitting-its-lowest-level-since-october-2024.html
- CoinDesk, Deutsche Bank on bitcoin’s June drop (June 23, 2026): https://www.coindesk.com/markets/2026/06/23/bitcoin-s-recent-drop-below-usd60-000-signals-fed-etf-and-ai-pressures-deutsche-bank
- Bitcoin.org, FAQ: https://bitcoin.org/en/faq
- SEC, Statement on the Approval of Spot Bitcoin Exchange-Traded Products (Jan. 10, 2024): https://www.sec.gov/newsroom/speeches-statements/gensler-statement-spot-bitcoin-011023
- Investor.gov (SEC), Crypto assets: https://www.investor.gov/additional-resources/spotlight/crypto-assets
- Volatility, worst-day, big-move-day and one-year change figures: The Market MBA’s calculations from Yahoo Finance daily closes, Nov. 3, 2025 to Nov. 3, 2026
🌐 MrFlourishinvests.com (in BETA) – Daily market moves, stock ideas, and money flow from MrFlourish and Team.
🌐 TheMarketMBA.com (in BETA) – Plain-English lessons on how markets, investing, and money really work crafted by MrFlourish and Team.
NFA
For education only. Not financial, investment, legal or tax advice.
For education and entertainment only. Not financial advice.